Showing posts with label Analytics. Show all posts

Reasons To Perform A Social Media Audit

reasons perform social media audit

Given that resources are limited, it is essential to use what is available to an optimum level. Social media networks need a flawless action plan to interact and gain business insights from consumers. Social media audit tools have proven effective in today's world. The word audit, in this case, carries a different meaning compared to when the IRS is involved. 

Here, a social media audit is all about examining what works in your favor and adopting brand success strategies. Social media is continuously evolving, and, in the process, there can be many inactive accounts. During a social media audit, numerous areas should be reviewed. For starters, evaluate your online existence and keep a record of the profile of your brand on different social media channels. 

Keep tabs on both the active and inactive accounts that bear your brand's profile. You can use Google, NameChk.com, and KnowEm.com to find your passive accounts. There is always the elimination option for accounts that are no longer in use. Alternatively, if you feel that you might require them after a while, you could choose to hang on to them. 

The importance of monitoring passive accounts is that your brand may grow a significant following on the platforms, and it is best to be aware of such developments. When you track down all your social media accounts, evaluate the harmonic flow of your profile. It is easier to jot down all social actions on a worksheet. Once you establish a regular social pattern, your client base can know your brand across numerous channels. 

Consistency differs significantly from identical, but there needs to be a regular flow on all your social profiles. Your profile outlook is another critical factor; go over the image specifications, headers, and laid-out rules on particular social channels. Update your bio regularly to remind your audience about your brand. Also, verify whether you have posted the relevant and updated links. 

A wrong URL in an Instagram promotion is detrimental as the platform has a significant impact on social media. As a benchmark tool, use your worksheet to keep track of your social media accounts. Among the many things to account for are likes, shares, comments, views, mentions, number of followers, and main audience sections. Use these factors on the different social channels one at a time, or you can contrast them where relevant. 

When looking at shares on Facebook, you could contrast that to the number of retweets on Twitter. With the entries made on a worksheet, the idea is to determine where the components lie at a particular time. You get to decide on the length of time, and it could range from a month to a year. Once you zero in on the amount of time you prefer, you can acquire the precise information needed using social media audit tools. 

After you have gathered a few audits over time, you can compare them to each other to establish the progressive trend. To ascertain the progress percentage, you can have a column that keeps track of one audit to the other. The most efficient audit comparison is done after a year since the month to month may have inaccurate data. January differs from December since holiday sales are higher in the latter month. Seasonal differences are better studied when contrasting audits after a year. 

A Brief History 

NetBase is a next-gen company that relies on artificial intelligence to provide useful information to firms across the world. The info captures streams in every other minute and can help manage brands, establishing enterprises, and creating strong bonds with clients. NetBase continuously assembles information on research, customer service, public relations, product development, and marketing. The firm's tremendous strides have earned recognition from Forrester, TrustRadius, and G2 Crowd.

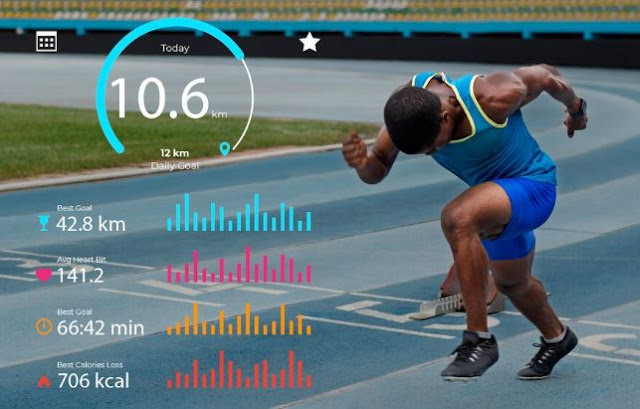
How To Improve Fan Engagement With Sports Analytics

importance fan engagement cutting-edge sports analytics

In the world of digital sports, the game doesn't stop at the field. It is a data-packed spot where tactics, player moves, and fan engagements take center stage. As sports analytics continue to evolve, the bond between teams and their fervent fans has never been stronger. Imagine a world where every stat tells a tale. Then, every match unfolds to meet every supporter's needs. That is the charm of cutting-edge sports analytics. It is a virtual territory where fans are not just lookers, but they are MVPs! With customized content galore, the possibilities are endless. Let's unearth how game-shifters like casino sites and top teams utilize analytics to drive fan participation. 

What Is Sports Analytics? 

Sports analytics involves decoding team strategies, dissecting player dynamics, and analyzing those jaw-dropping athletic moves. Kudos to some cool tech advancements; analytics have occupied the front seat in sports. It provides leagues with an inside scoop on how to level up their games and dominate the court. Here is the best part: fans, yes, you heard me right, they are also living large with analytics! They get to geek over stats and know their sports heroes on a new level. Then, they transform into a super fan! By staying updated with the latest sports marketing trends, teams and leagues can help improve fan engagement and create more fun experiences. This can help fans feel connected as well as open up more ways for new marketing strategies. 

sports fans engagement sporting media

Key Features Of Cutting-Edge Sports Analytics for Fan Engagement 

- Metrics 

Metrics in sports analytics means the specific statistics used to analyze various aspects of game dynamics. It varies depending on the nature of the sports. However, it usually includes factors like speed, scoring rates, time spent in acquisition, and many others. For instance, the rally count is for badminton, while the run-pass balance rate is for soccer. 

In essence, metrics enable analysts, supporters, and coaches to identify the strengths and weaknesses of a team or player. 

- Motion Tracking And Big Data 

Cutting-edge sports analytics uses big data, motion tracking, and many other tools to drive fans' participation. Motion tracking enables you to gauge player movements and metrics. 

On the other hand, Big data tailors recommendations based on your preferences. These mechanics work together to create an engaging and dynamic gaming environment. 

- User Boards And Player Fitness Dashboards 

User boards allow loyalists to access a player's statistics and comparisons. It makes you feel connected to the game and its athletes. 

In the same breath, the incorporation of the athlete fitness dashboards enables you to track the player's health. You can also discover his/her performance metrics through them. 

Top 4 Ways of Improving Fan Engagement with Sports Analytics 

1. Decision Making 

Sports analytics offer incisive insights into player stats and game scenarios. Managers can use these pieces of information to make informed decisions about substitution strategies and game plans. This will ultimately boost the team's chances of victory. Fans can also use them to decide whether to bet for or against a specific team or player. 

2. Talent Scouting 

Analytics also plays a vital role in scouting players. Scout agencies can identify players who are a perfect fit for their team's playing style and needs. They explore performance metrics, matching them up with the team's requirements. 

Fans leverage analytics when it comes to player selection, too. It helps them to see which players can become the next big thing for the squad. It means that they can also make accurate predictions about the players who might need a little cheering to reach their full potential. 

3. Fan Participation And Customized Experience 

Sports analytics is not only impacting talent management. It also revolutionizes the way fans engage with sports. With the rise of streaming sites and social media, data-oriented insights are helping bookies to create personalized experiences. Sports platforms look out for your region, sentiments, and many things. Then they provide content and offers based on your habits, preferences and even your mood! 

Customized interactions foster fan loyalty and active participation no matter where they are. 

4. Bolsters Sports Broadcasting 

It is not about watching and betting on sports anymore. You just need to live it in order to get it. Sports broadcasting has leveled up with data science. Real-time data analytics allows broadcasters to provide in-depth analysis during live games. In this way, viewers, including fans can, learn some more. 

During the live sessions, broadcasting studios leverage virtual and augmented reality technologies to offer immersive viewing experiences. So it feels like you are right there on the courtside, soaking up every moment. 

Conclusion 

Cutting-edge analytics bring the A game to the world of sports. With tools like user boards, VR, AR, and more, fans are no longer spectators. They are now much involved in the action. So the future of sports is right under in footsteps. It is one crazy ride you won't want to miss.

Difficulties Of Forecasting Political Elections - Poll Prediction Problems

difficulty forecasting political elections wrong polling

Why can’t we forecast political elections accurately? This most recent presidential election and the house / senate races have shown us that polls aren't always spot on. Politics is an uncertain science and you would be one of the most powerful people on the planet if you could consistently predict election outcomes.

One of the major questions that came out of the last week’s US election was why various polls and forecasts were unable to predict the outcome. For clarity, there are three general kinds of predictions when we are talking about elections: opinion polls, exit polls, and forecasts. 

Opinion polls are run by a variety of organizations in the run up to an election. Exit polls are run by Edison Research and the National Election Pool and occur during voting. Forecasts are mathematical models various groups assemble based on differing datasets to attempt predicting the outcome. In this election, as in previous elections, the exit polls were correct. 

Opinion polls varied in correctness, and forecasts were generally incorrect. And some political campaign polls that were poorly constructed or biased ended up being more accurate, albeit as just a coincidence.

Why can’t something as time-bound and important be accurately forecasted? Here is the simple explanation and a golden rule of predictive analytics: you cannot forecast something that has never happened. All models and forecasts require previous data, and the more regular and frequent that data, the better the forecast. Elections fail on both counts. Political elections are very infrequent, compared to things like e-commerce transactions. Elections are also highly irregular. Why are election events so strange? 

Elections may happen regularly in America, but what is being voted on varies wildly from election to election. Each candidate is different - even if the same candidate is running for re-election. 

Imagine trying to forecast how two movies will perform against each other, but it is a new and different set of movies every time. A romantic com vs a science fiction flick. A documentary vs a horror film. It is never the same politician lineup, so it is very difficult to forecast. Now imagine trying to do the same thing, but the movie theater moves around. One year it is in New York City, the next year it is in Peoria. 

Will Captain America play better in one location than another? What about the newest Fifty Shades of Grey movie or spinoff? That is what has been happening in American elections as the population changes. 

The America that voted in politics and pop culture last week is not the same America that voted in 2020, or the same America that voted in 2016. Add onto that all the hidden inputs that normally mess with models, from differing marketing tactics to foreign interference to social networks, and suddenly we have an insurmountable amount of relevant data we would need to forecast an election in 2023 or 2024. And then add a pandemic. Is it any wonder forecasts and models failed to predict the outcome? 

Here is the lesson we must learn from politicians as marketers: you can’t forecast what has never happened. If you are in the throes of 2023 planning right now, you are probably looking back at past data and trying to project it forward. Beware! The world you operate in right now is very different than the world in January of 2020 - completely different due to global events. This is a new world, a new operating environment where the customer does fundamentally different things than they did 12 months ago. 

Forecasts and models built on last year’s data almost certainly will be wrong. What should we do instead? Rely heavily on near real time data. Look at trends that are recent, rather than pre-pandemic. If we are trying to forecast something new - a product or service we haven’t ever launched, the tenure of a new executive, etc. - we should expect our forecasts to potentially be radically wrong. 

And be doubly cautious of vendors promising they can reliably forecast the future. No one can reliably do that now for any substantial time horizon. 

It is a brave new world for all of us, and nothing is guaranteed now. Focus not on what could happen, but what is happening right now. We still don't know exactly what is going to happen with a new presidential inauguration, the upcoming 2023 and 2024 races, or overseas elections either. I guess it is politics as usual: expect the unexpected. Time will tell!

Why Is Brand Tracking Important?

why is brand tracking important

When you’re running a business, it’s important to track how it’s performing. If you don’t have a quantified, objective measure of the success (or otherwise) of your projects, products and investments then you don’t know if you’re making good decisions. 

This leaves you a fresh dilemma: what kinds of tracking are worth your investment and your time? You could spend a potentially infinite amount of money on different kinds of research into your own business and spend all the time you would otherwise devote to making decisions for your business on examining the results. You need to decide what’s important and make sure you’re getting the information that will help. 

One of these research methods is called Brand Tracking and today we’re turning our focus on it so you can judge if it’s an insight you need for your business. 

What Is Brand Tracking? 

In some ways, brand tracking does exactly what it says on the tin: it tracks your brand. By regularly surveying customers and asking them to rate your business on the key qualities you’re aiming for in your brand, and also rank your brand with your competitors in the field. 

This lets you see the impact your decisions have on how your customers see your brand, and if a marketing push or sale has made your brand more attractive or undermined it. 

Why Is Brand Tracking Important? 

Your brand is one of your most useful assets. It’s what allows your customers to relate to your business on a personal level, an identity with values and qualities that they can feel loyalty to. If all your decisions (not just the tone of your marketing campaigns, but everything from your price point to the words customers hear when they call your helpline) are based on an understanding of what customers value about your brand, then you can make sure they’re all reinforcing that perception and strengthening your brand. 

If you don’t know what customers are expecting from an interaction with your business, then you can’t make informed decisions about reinforcing your brand, and you might find different elements of your business are pulling against each other and undermining the customer experience. 

If your marketing paints a picture of a luxury brand in one campaign, persuading customers to make a significant spend in return for a status symbol of a product, but your next push is based on value and big sales then you’re undermining your own brand and leaving your customers confused about what exactly you offer them. 

Brand tracking lets you see how your decisions affect your brand in real time, as the consequences play out. This lets you adjust your course if needs be and makes sure your decisions are strengthening your brand, not damaging it.

How To Exploit Data To Make Well Educated Business Decisions

how you can exploit data make well educated business decisions analytical choices data science

Historically, the value of a business focused mostly on the health of the most recent balance sheet. Essentially accountants could, at a glance, determine asset strengths and liability weaknesses, then offer an informed viewpoint as to what actions were needed to improve things. As a process of its time, this worked fine. 

But fast forward to the present, and although financial statements retain all their validity, the balance sheet does not declare the value of the business’ data — arguably one of the most important and under-utilized asset. The value of data cannot be understated, as the opportunities it offers are immense. Sitting in the depth and breadth of transaction information, customer activity, purchasing, stocking detail etc, there is value to be found through a variety of applications and interpretations of this data. You just need to have to right tools to extract its gold mine potential in order to make your business greater. Moreover, data is an asset that does not depreciate, but grows day-by-day, almost effortlessly. This is something that is extremely exciting for the future of any business, large or small. 

Businesses must decide how best to work the data and bring home the spoils. Right now, you may be thinking about whether your current systems are up to the mark. Are they already maxed out in terms of harnessing the power of your data? Do you have absolute confidence in the quality of information you have available? Perhaps it’s time to take a step back and look at the bigger picture and the impact on your business model. A review such as this can highlight weaker areas of your business model that, once addressed, can push your company up to larger successes. 

Buying, stocking and distributing goods, in a trade, wholesale or even retail sector has moved on considerably since the dawn of the internet. Customer service expectations have been transformed to an on-demand model — a business that cannot fulfill an order quickly will be abandoned by a customer more than happy to shop elsewhere. Customers not only want to know your stock position, but they want and expect you to be looking after them pro-actively. Pro-active customer service requires quality communications to suit their needs. These processes are vital in order to make them feel important. But in order to achieve this, your systems need new levels of capability. Without it, you may find customers heading over to your competition instead. 

In the same way that systems have become more sophisticated, more capable and more functionally rich, there is also an expectation to see greater ease of use and more flexibility. If applications are not intuitive then they simply won’t get used. Browser-based deployment and fully mobile-enabled capabilities are must-haves. At no point should a user be required to re-key data. Every application should be seamlessly integrated with one another. 

Using data to make decisions is about having the relevant information you need available in an instant. More than that, you want the data to be presented ‘dashboard style’ for easy, timely decision-making and be able to highlight the opportunities within the complete picture, risk-free. Whether the task at hand is to spot gaps in buying patterns and sales trends, or to create effective new campaigns, being able to have your finger on the pulse has become mission critical. Those empowered and duly authorized to make the right informed decisions at the right time will be able to enjoy increased job satisfaction. At the same time, the business will be able to operate with renewed and profitable vigor. 

Warehouse management specialists, Kerridge Commercial Systems have been at the forefront of developing fully-integrated solutions to the manufacturing and distribution sectors for over 40 years. The company’s latest generation of advanced applications incorporate all the requirements for efficient trading with comprehensive CRM, data analysis, and decision-making capabilities. Tony Pey, Head of Product Marketing, says: “Our solutions have been finely developed in partnership with our customers over many years. Right at the forefront now in terms of applications that can help businesses make timely, well-informed decisions, our Vecta sales analytics and CRM solution is immensely capable. It enables the user to stay in the driving seat and run the business their way. Implementation is straightforward — Vecta is easy and intuitive to use and results can start to kick in within days of going live.” 

What does the future of data management hold then? In short, the bar is likely to go up even further as competitive pressures grow. It is particularly exciting that businesses are employing young, enthusiastic, IT-savvy staff, who have a greater awareness of the potential of technology. Particularly, this generation of staff know how to make the most from the applications and tools available. Bringing this to the forefront means that any business can not only improve decision- making processes but have the implicit trust and confidence that the information before them is accurate and reliable. Together with the need to serve customers to the levels now demanded, this is what it’s all about — with a stronger balance sheet and healthier P&L to show for it.

Quality Quantitative Analysis Methods

quality qualitative analysis methods research the lean startup

2 new papers are published to PubMed every single minute.

And that’s only from the biomedical field!

Take the other disciplines into account, and that number would dramatically shoot up. Clearly, research is being conducted at any one time, all over the world.

However, not all research is the same. Different studies utilize different methodologies. Quantitative research is one particularly noteworthy type. This research is based on numbers. It is an investigation of empirical nature intended to explain, in numerical form, a phenomenon in the world.

Want to learn about the 4 different types of quantitative analysis? Keep reading.


1. Descriptive

As the name suggests, descriptive analysis methods attempt to describe a particular variable’s (or phenomenon’s) current status.

Contrary to other forms of quantitative approach, researchers tend not to start with a hypothesis. Instead, they develop one as they begin to accrue the relevant data. The hypothesis is then tested via the careful analysis of the data collected.

An example might be a description of the types of vocabulary used in data and researches services (FYI, it gets confusing- what on earth is asset beta or equity beta!?).


2. Correlational

This is research into potential relationships between particular variables.

For instance, there might be a correlation between weather and ice cream sales. This quantitative approach would analyze the nature of the relationship using statistical data.

Researchers might find that the warmer the weather, the more ice creams get purchased from vendors.

However, it’s essential to understand that correlation doesn’t necessarily imply causation. AKA, that increase in ice cream sales may be explained by another unknown variable. Consequently, these experiments are generally only observational in nature.


3. Quasi-Experimental / Causal-Comparative

In these experiments, researchers try to find out a causal relationship between 2 or more variables.

In that way, they’re similar to experimental designs (more on these next). However, the process is different. Participants aren’t randomly assigned to groups. Instead, pre-established groups are used. Likewise, though an independent variable is chosen, it isn’t manipulated in any way.

Control groups are established and they’re subjected to the variable. Another group isn’t exposed to it. The effects of the two experiments are compared.


4. Experimental

Experimental studies are what you usually think of in terms of top-level scientific research. Indeed, it’s sometimes referred to as ‘true experimentation’.

Again, the desire is to establish a causal relationship between variables. However, this time each variable is controlled apart from the independent variable (the one to be manipulated).

The effects of this manipulation are measured before statistical analysis reveals (or doesn’t) a potential relationship.


Final Thoughts of Quantitative Analysis

There you have it: a look at the 4 different methods of quantitative analysis.

As we’ve seen, the scientific community is awash with research. Every day, countless new pieces of research are being conducted and published. Much of the time they’ll be utilizing quantitative methods to gather the data and find their results.

Hopefully, this article has highlighted the main ways they can go about it.

Like this piece? Read more interesting research-related articles on novel topics on the blog!

The Lean Startup Life Media Network Newest Blog Posts: